The Carbon Tax and ‘Noble Cause Corruption’
Just so you know where I stand on global warming, climate change and CO2 issues, I would consider myself a pragmatic sceptic. I prefer to rely on peer-reviewed facts – not opinions. I like to review facts in context – not in isolation. I find this helps me to see past much of the political bluster and extremist propaganda (on both sides of an argument).

The Carbon Tax is supposed the change our habits so that we limit our ‘carbon footprint’, that is, to reduce the amount of CO2 we are individually responsible for being emitted into the atmosphere. Is the Carbon Tax actually an effective means of changing our habits? If there is no change in our individual and corporate habits then the Carbon Tax is a pointless and expensive burden placed upon Canadians by the current Liberal Government. Is the Carbon tax, in effect, a political corruption of a noble cause?
Statistical Sleight of Hand?
British Columbia, which is often held up as the ideal example, being the first province to introduce a Carbon Tax in Canada. This was back in 2008. What was the outcome? According to official statistics, gasoline purchases in 2014 were approximately 200-megalitres lower (from 10,800 ml down to 10,600 ml), an imperceptible 0.19% drop, than in 2008. As you will see in the chart below, sales of gasoline in BC actually started their decline in 2004, 4-years prior to the introduction of the tax. Two very important observations need to be made: first, the dramatic drop in 2008 was a near-universal reduction as a consequence of the worldwide 2008/2009 recession, and second, back in 2013 the Business Council of BC reported, “same-day trips to the US from the lower mainland region have risen from 2.3 million trips annually to nearly 5.7 million last year.” [Note: more current data is being sought]. The BC numbers are on the left of the chart, rest of Canada on the right.
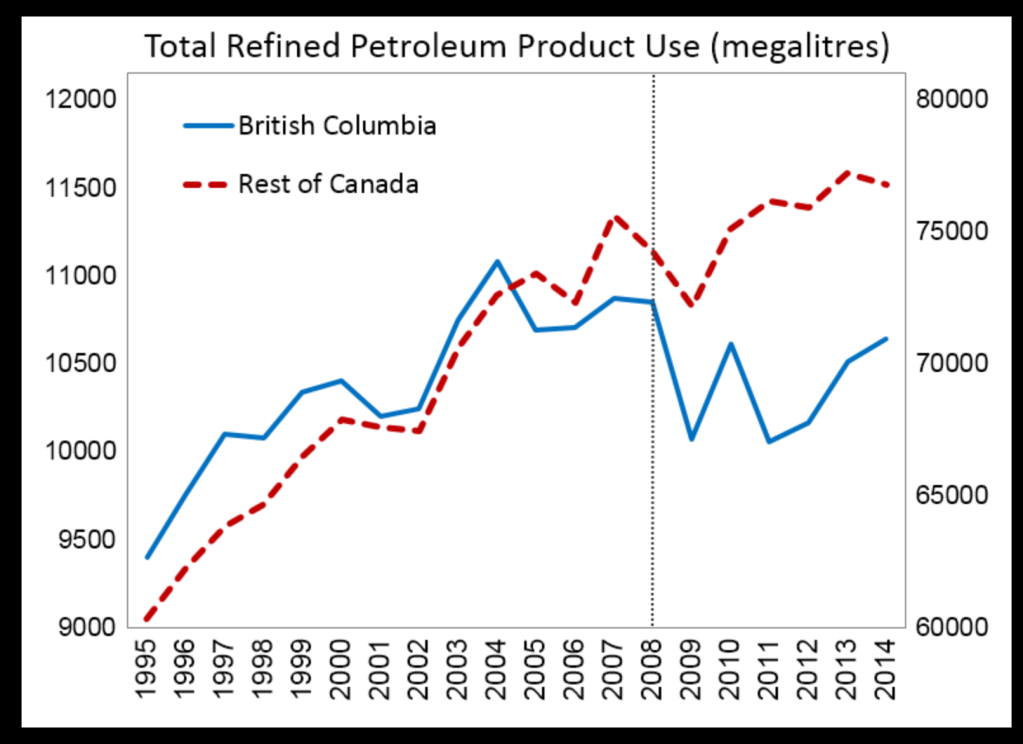
Today, the cost of a litre of gasoline in Vancouver is $1.48, compared with +/- CDN $0.93 per litre (US $2.69/gal) just across the border. If one is to assume that each same-day traveller filled up with 50-litres of gasoline, this would indicate purchases of 285-megalitres of gasoline made in the USA, representing a dramatically higher level of consumption than official statistics recognize (almost 65% more than the supposed reduction). The simple truth is that gas consumption in ‘eco-friendly’ BC does not seem to have had its driving habits impacted beneficially by the Carbon Tax in any way at all.
Behavioural Change?
The primary argument against a Carbon Tax, especially a tax gradually increasing over a number of years, is that it is very unlikely to affect individual Canadians’ behaviour, which is the desired outcome. The following is a case-in-point: “From 1990 to 2013, per capita VKT [Vehicle Kilometres Travelled] increased by 2.56%, reaching 9,014 km travelled per person in 2013. During this time, inflation-controlled gas prices in Canada grew by approximately 38%, peaking in 2008.” Shenstone/Harris 2016 As with gradual price changes, people are unlikely to change their eating habits (during the long Canadian winter virtually all fresh produce is imported by truck, with only a small percentage of truck km actually driven in Canada), and Canadians will continue to heat their homes, in winter and cool them in the summer, etc., as a consequence of basic necessity.
Hurting the Most Vulnerable?
Even though the Liberal Government is promoting the argument that families will receive a rebate at the end of the year, it is taking that cash out of Canadians paycheques every month, typically when they need it the most. Given the recent headline that, ‘40% of Canadians are $200 away from insolvency’ [another statistic fraught with skepticism], means that cashflow is all important to families, and not a year-end rebate. Given that Canada’s largest industrial polluters are exempt from, or pay reduced Carbon Taxes, only a very direct ‘carrot and stick’ solution will change individual habits.
What can we do to make measurable changes in Canada’s Carbon Footprint?
No. 1. Improve public transit. There is a direct correlation car usage and the availability and efficiency of public transit. In the chart below compare Prince Edward Island to British Columbia. This chart also shows the dip in most provinces caused by the 2008/2009 economic crisis.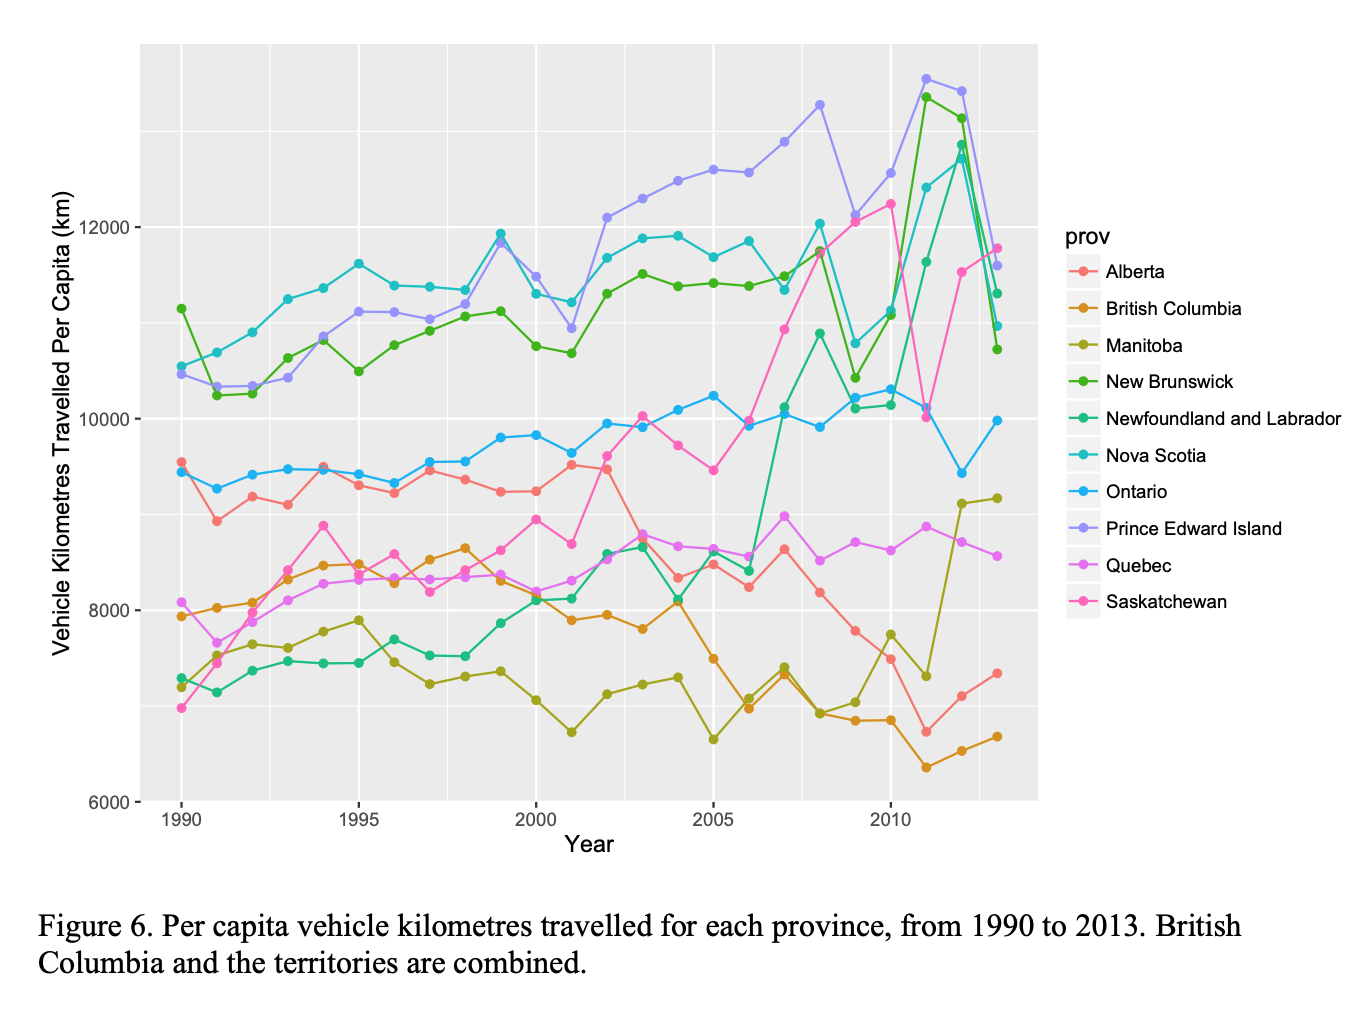
No. 2. Encourage the use of electric vehicles. Placing a premium ( an ‘ICE Tax’) on vehicles with Internal Combustion Engines and using that same tax to subsidize Zero Emissions Vehicles. 2.038 million new vehicles were sold in Canada in 2017. Placing a graduated tax, starting at $500 and rising to $2,500 for the worst polluters, would bring in approximately $3-billion in revenues that could be used to subsidize ZEVs. The revenues would be on a declining scale as more and more ZEVs are purchased.
No. 3. Use the same incentive principle for the purchase of transport trucks. Most major truck manufacturers are investing in ZEV technology. An ICE Tax would accelerate their introduction.
No. 4. Invest more in nuclear and hydro technology.
No. 5. Incentivise people towards personal energy efficiency. For example, using a $99 programmable timer on an electric hot water tank (so that it is off during peak periods) and can save $200+/yr.
No. 6. Incentivise Canadian (local) manufacturing. This is usually done by cutting through the ‘red tape’ (unnecessary rules and restrictions) and reducing corporate taxes for manufacturers. When an individual purchases products from outside of Canada, transportation is one of the most significant CO2 contributors to a product’s carbon footprint. Canada as a whole doesn’t emit a lot of CO2 compared to other manufacturing countries like China and India. Establishing a Carbon tax in Canada will have a miniscule effect on worldwide CO2 emissions while other countries do not have to pay that Carbon tax. The Carbon Tax will stifle our industries while other countries are be producing the same goods at a significantly lesser cost.
The following is a simple example:
Today 1-pound of steel costs +/-$0.35. Assuming the base-cost remains the same, when the Carbon Tax is fully implemented in 2021, Canadian produced steel will cost $0.38 cents/pound, while imported steel remains at $0.35.
No. 7. Level the playing field. If there is going to be a Carbon Tax, apply it to all imports. As of 2017, only 65 jurisdictions, representing about 15% of global GHG emissions, have put a price on carbon.
A Few ‘DID YOU KNOW’ Facts:
(from the EDGAR database)
“A conservative estimate of Canada’s existing carbon-absorption capacity, based on land area and the global carbon-absorption average, indicates that Canada could already be absorbing 20 to 30 per cent more CO2 than we emit. Using the same calculation, the “Big Four” polluters of China, the U.S., the European Union, and India, which together are responsible for a whopping 60 per cent of global CO2 emissions, release 10 times more CO2 than their combined land area absorbs. Canada doesn’t seem very dirty now, do we?” Financial Post
1. Canada ranks 9th in the world on total CO2 emissions, and 12th on individual emissions.
2. Canadians produce 62t of CO2/sq Km/yr. This compares to Russia 103t, New Zealand 136t, Mexico 258t, USA 519t and Holland a whopping 4,176t. Denmark, the land of wind turbines, produces 779t. Canada, is blessed with having the 2nd largest landmass in the world.
3. Canada’s 33-million individuals each produce 16.9t of CO2 per year. This is in spite of two very important facts: we live in a country with annual temperature extremes*, especially in the winter, and we live in a country of extreme distances**. In comparison, individual Danes produce 5.9t of CO2 per year, Australians 16.4t, and South Koreans 13.2t.
* Canada’s temperatures have a huge impact on individual energy consumption. In Winnipeg, MA, mid-winter temperatures average -21.4C and summertime temperatures of +25.9C. Denmark averages +1.5C in winter and +17.2C in summer.
** A direct flight from St. John’s Newfoundland to Victoria, BC, takes 8 hrs and 20 min, covering a distance of 6,800 km. Denmark by comparison is a country that has 0.43% of Canada’s land mass, and the farthest distance you can travel in one direction is 385 km .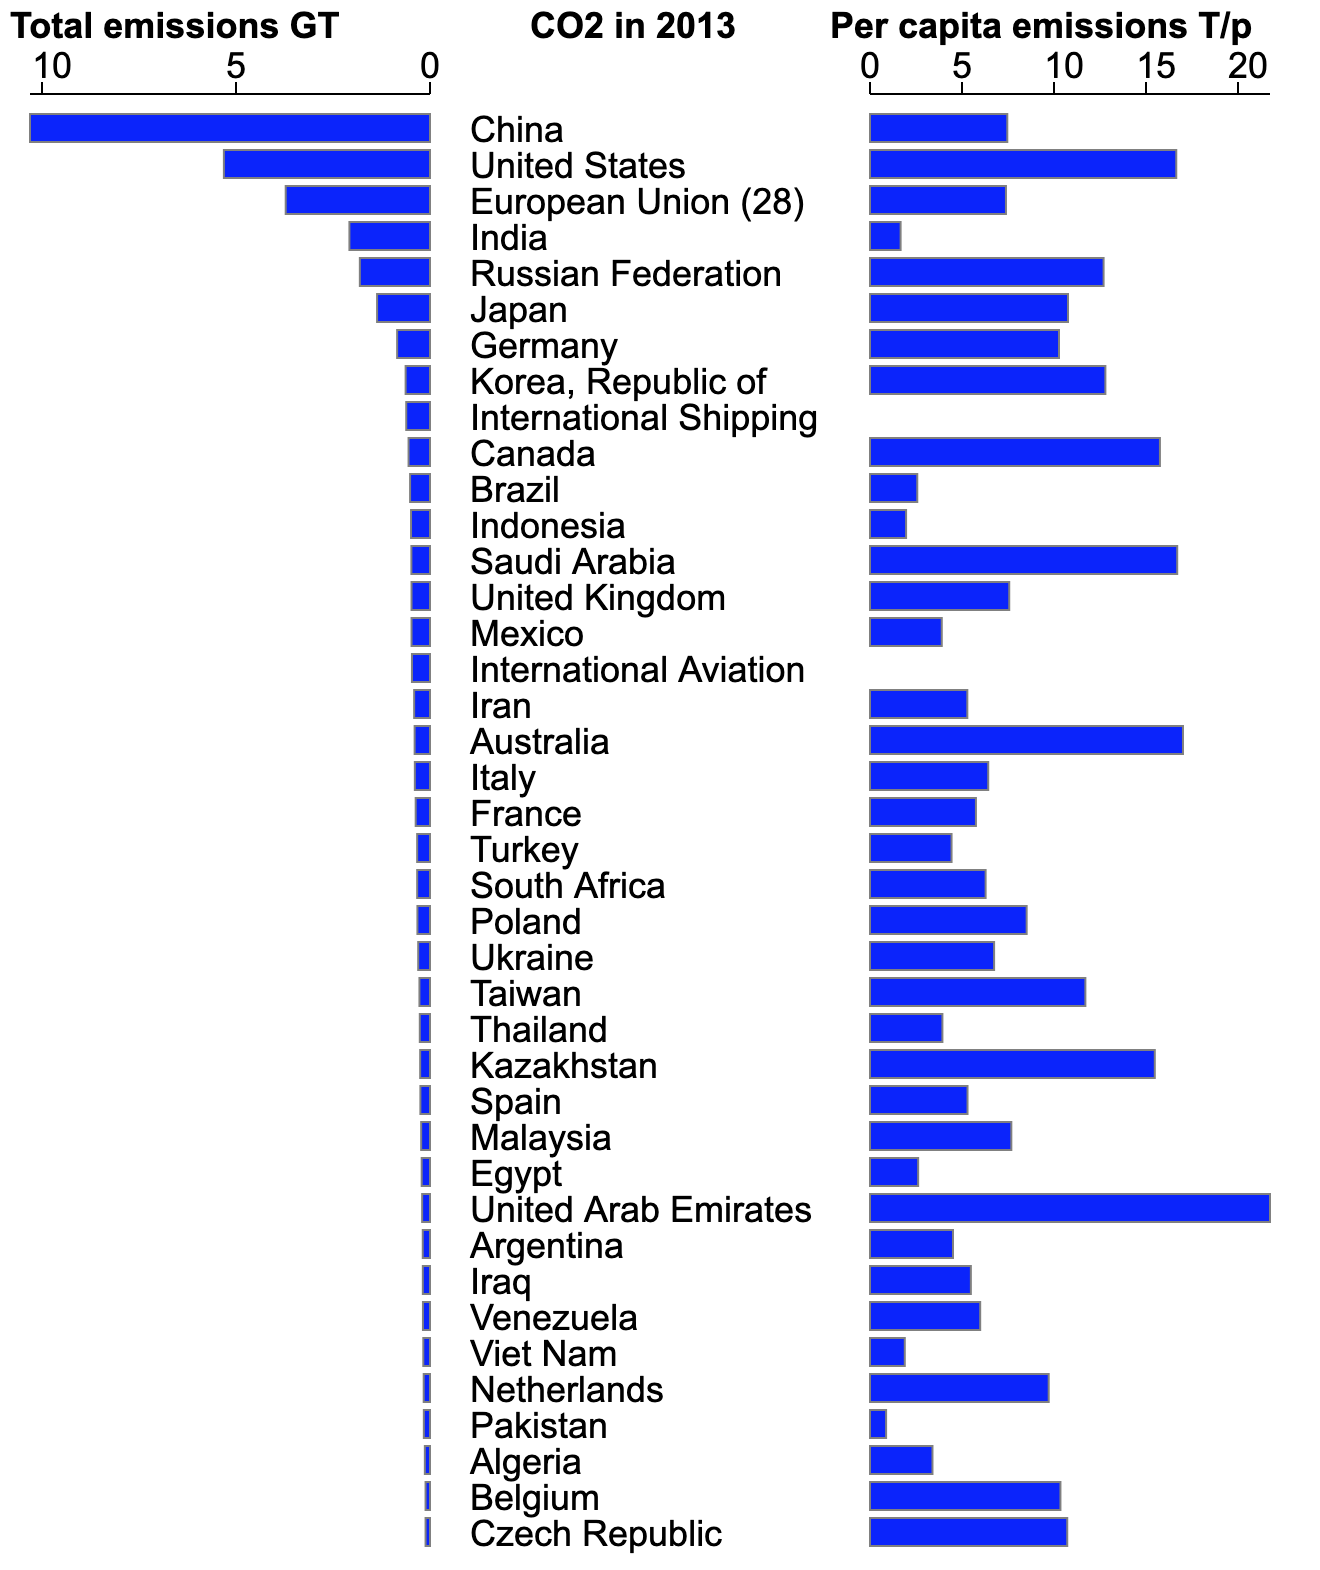
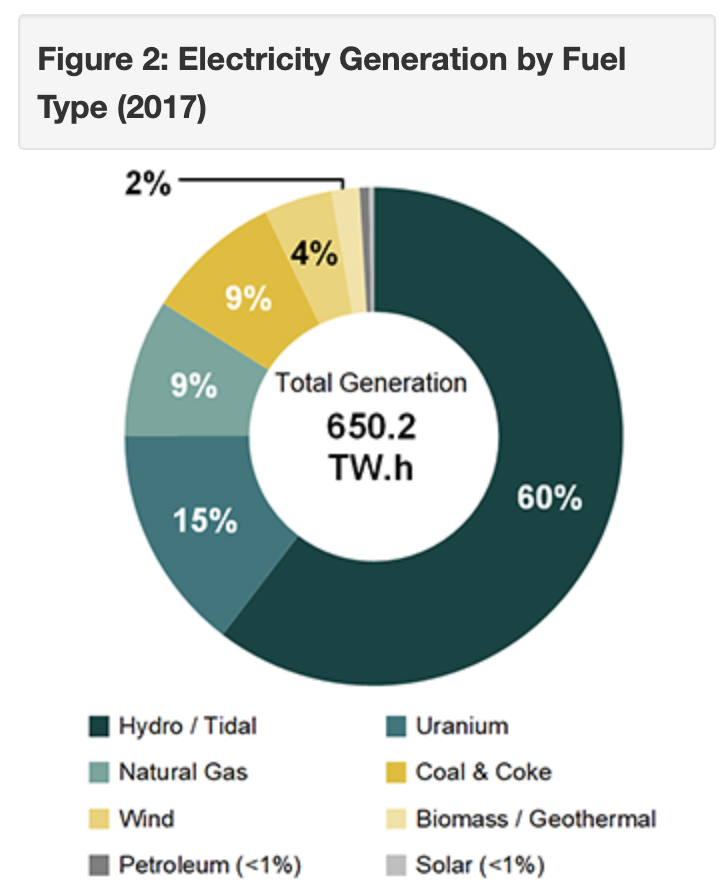
4. Did you know that 76% of Canada’s electricity is from zero CO2 producing sources?
5. Did you know that synthetic fabrics create a +/- 40% smaller carbon footprint than fabrics made from wool or cotton?
Transportation – Going All-Electric would reduce Canada’s CO2 emissions by 28% in about 10-years.
